Merhabalar,
Dijital dünyada sistemlerin kesintisiz çalışması, hem bireysel kullanıcılar hem de işletmeler için kritik önem taşır. Bu yazımda uptime kavramını, sistem erişilebilirliğini ve izleme tekniklerini detaylı olarak inceleyeceğim. Hem sistem yöneticileri hem de genel kullanıcılar için anlaşılır bir dil kullanarak, bu önemli konuyu ele alacağım.
Uptime Nedir?
Uptime, bir sistem, makine veya hizmetin kesintisiz çalıştığı süreyi ifade eden bir güvenilirlik ölçütüdür. Bilgisayar bilimlerinde, özellikle sunucuların ve ağ cihazlarının ne kadar süre boyunca çökme, yeniden başlatma veya bakım nedeniyle durmadan çalıştığını gösteren bir metriktir.
Temel Tanımlar:
🔄 Uptime vs Downtime
- Uptime: Sistemin aktif ve erişilebilir olduğu süre
- Downtime: Sistemin çevrimdışı, erişilemez veya çalışmadığı süre
- Availability: Toplam süre içinde sistemin erişilebilir olma yüzdesi
📊 Uptime Ölçümü
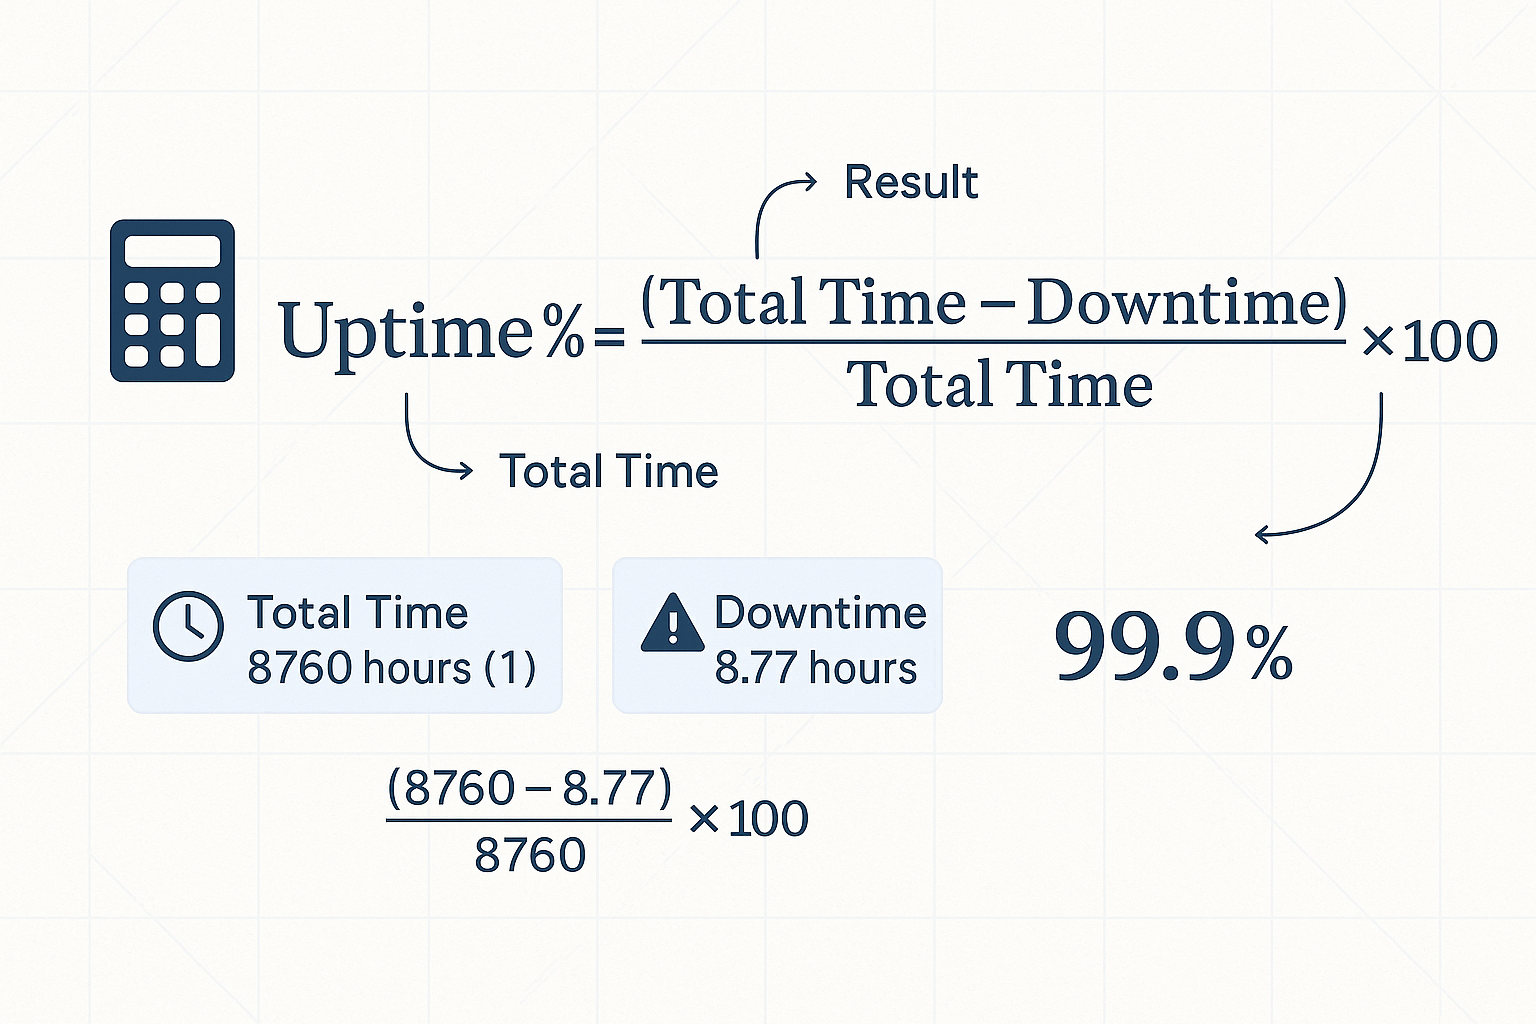
Uptime genellikle yüzde olarak ifade edilir:
1
| Uptime % = (Toplam Süre - Downtime) / Toplam Süre × 100
|
Uptime Sınıflandırmaları ve SLA Seviyeleri
Standart Uptime Seviyerleri
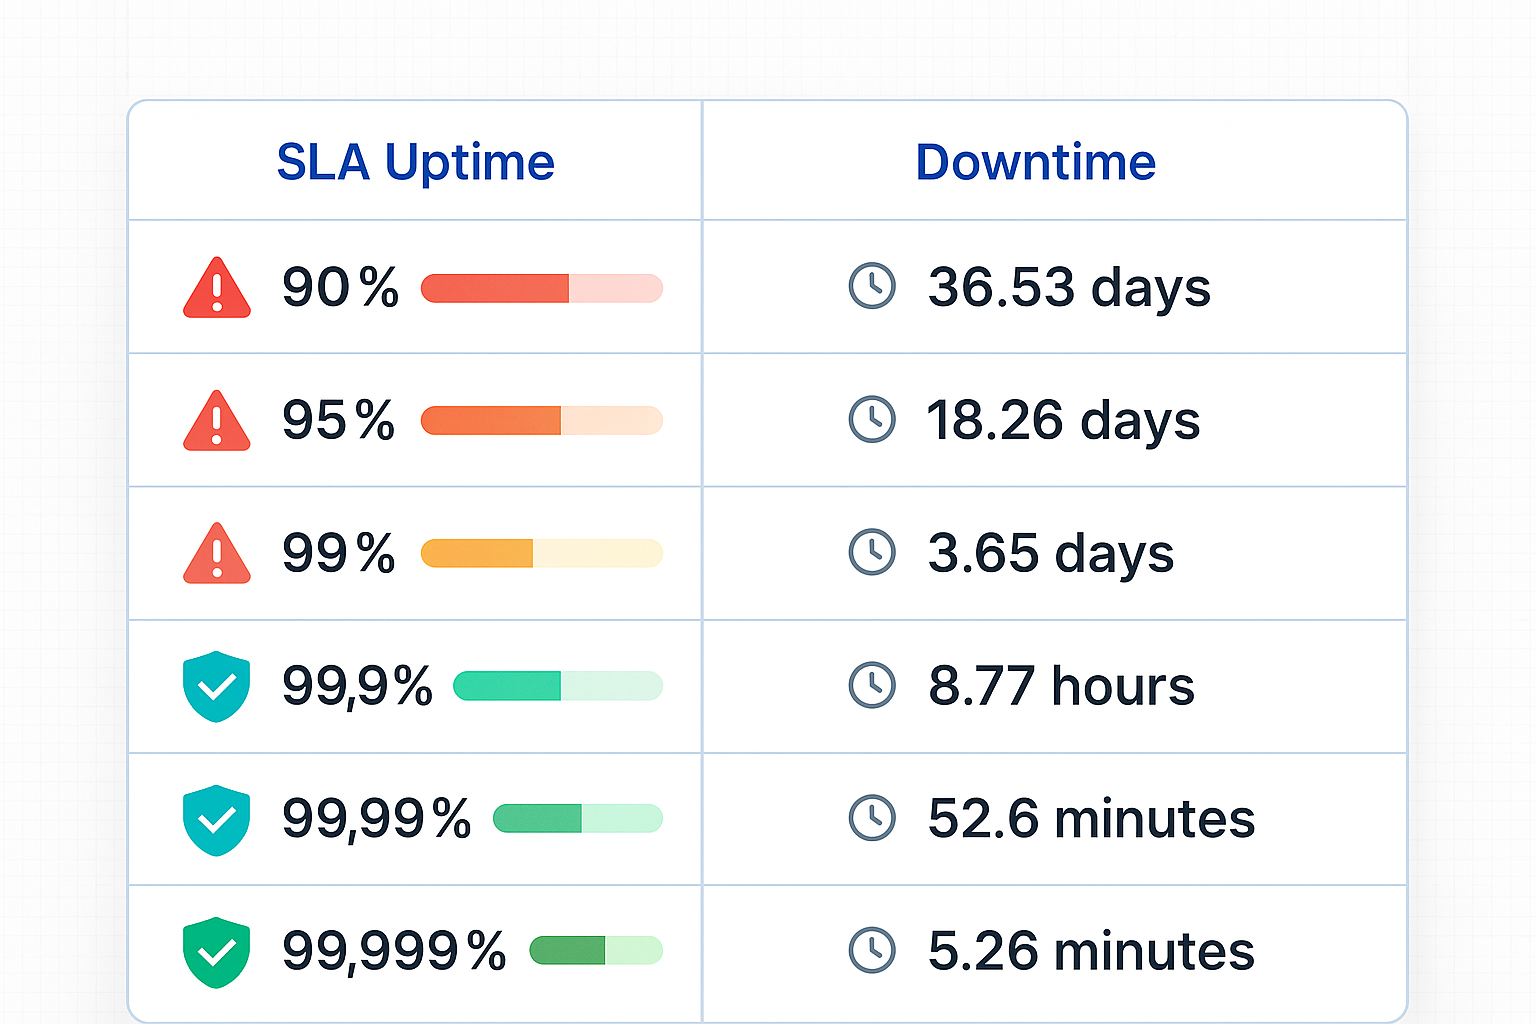
| Uptime % | Yıllık Downtime | Aylık Downtime | Haftalık Downtime | Günlük Downtime |
|---|
| 90% | 36.53 gün | 73 saat | 16.8 saat | 2.4 saat |
| 95% | 18.26 gün | 36.5 saat | 8.4 saat | 1.2 saat |
| 99% | 3.65 gün | 7.31 saat | 1.68 saat | 14.4 dakika |
| 99.9% | 8.77 saat | 43.8 dakika | 10.08 dakika | 1.44 dakika |
| 99.99% | 52.6 dakika | 4.38 dakika | 1.01 dakika | 8.64 saniye |
| 99.999% | 5.26 dakika | 26.3 saniye | 6.05 saniye | 0.864 saniye |
Endüstri Standartları
🏢 Enterprise Seviye (99.9% - 99.99%)
- Kritik iş uygulamaları için minimum kabul edilebilir seviye
- E-ticaret siteleri ve finansal hizmetler bu seviyeyi hedefler
- Yılda maksimum 8.77 saat downtime
- Telekomünikasyon altyapısı için altın standart
- Kritik altyapı hizmetleri (911 servisleri, hastane sistemleri)
- Yılda sadece 5.26 dakika downtime
☁️ Bulut Hizmet Sağlayıcıları
- AWS EC2: %99.99 SLA
- Google Cloud Compute: %99.95 SLA
- Microsoft Azure: %99.95-99.99 SLA
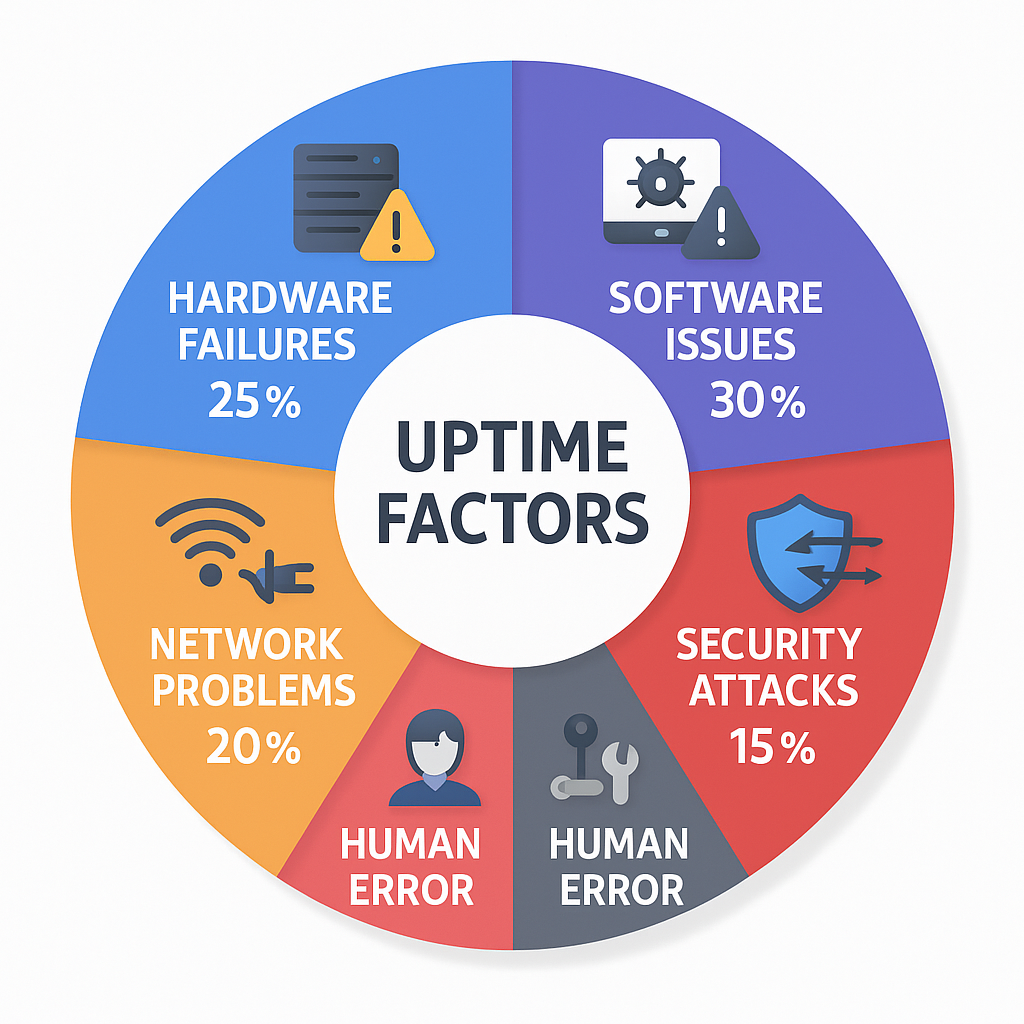
Uptime’ı Etkileyen Faktörler
1. Donanım Arızaları
Yaygın Donanım Sorunları:
- Disk arızaları: Yıllık %2-5 disk arıza oranı
- RAM hataları: Yaklaşık %0.1-0.5 oranında
- Güç kaynağı sorunları: %1-3 arıza oranı
- Ağ ekipmanı arızaları: Switch, router, kablo sorunları
Çözüm Stratejileri:
1
2
3
4
5
6
| # RAID yapılandırması ile disk redundancy
sudo mdadm --create /dev/md0 --level=1 --raid-devices=2 /dev/sda1 /dev/sdb1
# Sistem kaynaklarını izleme
sudo smartctl -a /dev/sda # Disk sağlığı kontrolü
sudo memtester 1G 1 # RAM testi
|
2. Yazılım Sorunları
Tipik Yazılım Hataları:
- Memory leak: Bellek sızıntıları sonucu sistem donması
- Deadlock: Kaynak kilitleri nedeniyle donma
- Buffer overflow: Bellek taşması saldırıları
- Race condition: Eşzamanlılık sorunları
Kod Kalitesi Metrikleri:
1
2
3
4
5
6
7
8
9
10
11
12
13
14
15
16
17
18
| # Örnek: Hata toleranslı kod yazımı
import time
import logging
from contextlib import contextmanager
@contextmanager
def error_handler():
try:
yield
except Exception as e:
logging.error(f"Kritik hata: {e}")
# Graceful degradation
time.sleep(1)
def robust_function():
with error_handler():
# Kritik işlem
process_data()
|
3. Ağ Problemleri
Ağ İlgili Downtime Nedenleri:
- DDoS saldırıları: Sistemin aşırı trafik ile çökmesi
- DNS çözümleme sorunları: İsim sunucusu hataları
- Routing problemleri: BGP hijacking, path loops
- Bandwidth limitleri: Trafik yoğunluğu
Ağ İzleme Komutları:
1
2
3
4
5
6
7
8
9
10
11
| # Ping testi ile erişilebilirlik kontrolü
ping -c 5 google.com
# Traceroute ile ağ yolu analizi
traceroute google.com
# Netstat ile ağ bağlantıları
netstat -tuln
# Bandwidth kullanımı izleme
iftop -i eth0
|
4. Güvenlik Saldırıları
Yaygın Saldırı Türleri:
- DDoS (Distributed Denial of Service): Sistem kaynaklarını tüketerek hizmet dışı bırakma
- Malware: Kötü amaçlı yazılımların sistem performansını etkilemesi
- SQL Injection: Veri tabanı saldırıları
- Zero-day exploits: Bilinmeyen güvenlik açıkları
Sistem Uptime’ını Ölçme Yöntemleri
Linux Sistemlerde Uptime Kontrolü
1. Uptime Komutu
1
2
3
4
5
6
7
8
9
10
11
| # Temel uptime bilgisi
$ uptime
18:17:07 up 68 days, 3:57, 6 users, load average: 0.16, 0.07, 0.06
# Sistem başlangıç zamanı
$ uptime -s
2025-05-27 14:20:32
# Sistem kaç zamandır açık
$ uptime -p
up 2 months, 1 week, 3 days, 3 hours, 57 minutes
|
2. /proc/uptime Dosyası
1
2
3
4
5
6
| # Raw uptime verisi (saniye cinsinden)
$ cat /proc/uptime
350735.47 234388.90
# İlk sayı: toplam uptime (saniye)
# İkinci sayı: idle time (saniye)
|
3. Sistem Başlangıç Zamanı
1
2
3
4
5
6
| # who komutu ile boot time
$ who -b
system boot 2025-05-27 14:20
# last komutu ile reboot geçmişi
$ last reboot | head -5
|
Windows Sistemlerde Uptime Kontrolü
1. Task Manager
- Performance sekmesinde uptime bilgisi
- Format: D:HH:MM:SS (gün:saat:dakika:saniye)
2. Command Line Araçları
# systeminfo komutu
C:\> systeminfo | findstr "System Boot Time"
System Boot Time:          05/27/2025, 2:20:32 PM

# PowerShell ile
PS C:\> (Get-Date) - (Get-CimInstance Win32_OperatingSystem).LastBootUpTime

# WMI sorgusu
C:\> wmic os get lastbootuptime
LastBootUpTime
20250527142032.123456+180
3. NET STATISTICS Komutu
# Workstation istatistikleri
C:\> net statistics workstation | findstr "since"
Statistics since 5/27/2025 2:20:32 PM

# Server istatistikleri
C:\> net stats srv
macOS/BSD Sistemlerde Uptime
1. Uptime Komutu
1
2
3
| # BSD style uptime
$ uptime
3:01AM up 69 days, 7:53, 0 users, load averages: 0.08, 0.07, 0.05
|
2. sysctl Komutu
1
2
3
4
5
6
| # Boot zamanı sorgulama
$ sysctl kern.boottime
kern.boottime: { sec = 1716815432, usec = 667779 } Mon May 27 14:20:32 2025
# Uptime hesaplama
$ echo "$(( $(date +%s) - $(sysctl -n kern.boottime | cut -d' ' -f4 | tr -d ',') )) seconds"
|
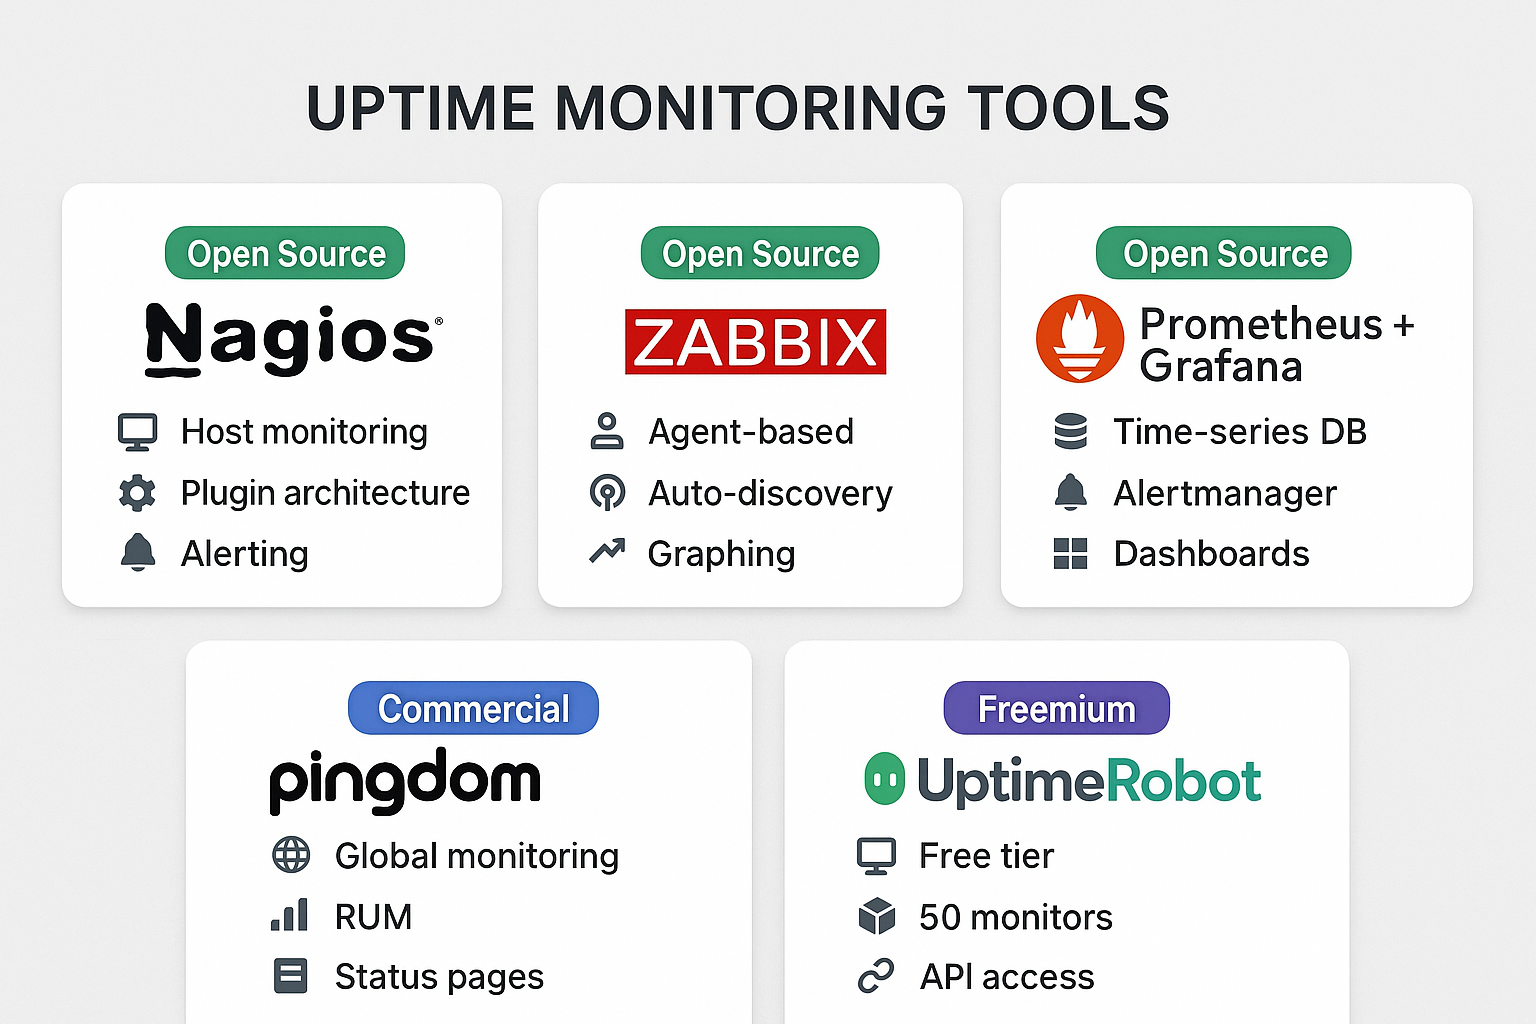
Profesyonel Uptime İzleme Araçları
1. Açık Kaynak İzleme Çözümleri
Nagios
1
2
3
4
5
6
7
8
9
10
11
12
13
14
15
16
| # Nagios kurulumu (Ubuntu/Debian)
sudo apt update
sudo apt install nagios3 nagios-plugins
# Temel host tanımı
define host {
use linux-server
host_name webserver01
alias Web Server 01
address 192.168.1.100
check_command check-host-alive
max_check_attempts 3
check_period 24x7
notification_interval 30
notification_period 24x7
}
|
Zabbix
1
2
3
4
5
6
7
| # Zabbix agent yapılandırması
# /etc/zabbix/zabbix_agentd.conf
Server=192.168.1.50
ServerActive=192.168.1.50
Hostname=webserver01
RefreshActiveChecks=120
UserParameter=custom.uptime,cat /proc/uptime | cut -d' ' -f1
|
Prometheus + Grafana
1
2
3
4
5
6
7
8
9
10
11
12
| # prometheus.yml
global:
scrape_interval: 15s
scrape_configs:
- job_name: 'node_exporter'
static_configs:
- targets: ['localhost:9100']
- job_name: 'uptime'
static_configs:
- targets: ['webserver01:9100', 'webserver02:9100']
|
2. Ticari İzleme Servisleri
Pingdom
- Sentetik izleme: HTTP, HTTPS, TCP, UDP, DNS kontrolü
- Gerçek kullanıcı izleme: RUM (Real User Monitoring)
- Çoklu lokasyon testi: Dünya genelinde 70+ test lokasyonu
- Alarm sistemi: E-posta, SMS, Slack entegrasyonu
UptimeRobot
- Ücretsiz plan: 50 monitöre kadar, 5 dakika kontrol aralığı
- Protokol desteği: HTTP(S), Ping, Port, Keyword monitoring
- Status page: Herkese açık durum sayfası oluşturma
- API desteği: RESTful API ile otomatik entegrasyon
New Relic
1
2
3
4
5
6
| // New Relic Browser monitoring
<script type="text/javascript">
window.NREUM||(NREUM={});
NREUM.loader_config={xpid:"VwUGUlJTGwACUVVRBgME"};
NREUM.info={beacon:"bam.nr-data.net",errorBeacon:"bam.nr-data.net"};
</script>
|
3. Kendi İzleme Sisteminizi Oluşturma
Python ile Basit Uptime Checker
1
2
3
4
5
6
7
8
9
10
11
12
13
14
15
16
17
18
19
20
21
22
23
24
25
26
27
28
29
30
31
32
33
34
35
36
37
38
39
40
41
42
43
44
45
46
47
48
49
50
51
52
53
54
55
56
57
58
59
60
61
62
63
64
| #!/usr/bin/env python3
import requests
import time
import smtplib
from datetime import datetime
from email.mime.text import MIMEText
class UptimeMonitor:
def __init__(self, urls, check_interval=300):
self.urls = urls
self.check_interval = check_interval
self.downtime_log = {}
def check_url(self, url):
try:
response = requests.get(url, timeout=10)
if response.status_code == 200:
return True, response.elapsed.total_seconds()
else:
return False, f"HTTP {response.status_code}"
except Exception as e:
return False, str(e)
def send_alert(self, url, status, error):
timestamp = datetime.now().strftime("%Y-%m-%d %H:%M:%S")
message = f"""
UPTIME ALERT!
URL: {url}
Status: {status}
Error: {error}
Time: {timestamp}
"""
# E-posta gönderme kodu buraya
print(f"ALERT: {url} is DOWN - {error}")
def monitor(self):
while True:
for url in self.urls:
is_up, result = self.check_url(url)
if not is_up:
if url not in self.downtime_log:
self.downtime_log[url] = datetime.now()
self.send_alert(url, "DOWN", result)
else:
if url in self.downtime_log:
downtime = datetime.now() - self.downtime_log[url]
print(f"RECOVERY: {url} is UP again after {downtime}")
del self.downtime_log[url]
print(f"OK: {url} - Response time: {result}s")
time.sleep(self.check_interval)
# Kullanım
monitor = UptimeMonitor([
'https://example.com',
'https://api.example.com/health',
'https://blog.example.com'
])
monitor.monitor()
|
Bash Script ile Sistem İzleme
1
2
3
4
5
6
7
8
9
10
11
12
13
14
15
16
17
18
19
20
21
22
23
24
25
26
27
28
29
30
31
32
33
34
35
36
37
| #!/bin/bash
# uptime_monitor.sh
LOG_FILE="/var/log/uptime_monitor.log"
ALERT_EMAIL="[email protected]"
THRESHOLD_LOAD=5.0
check_system_health() {
# CPU load kontrolü
LOAD=$(uptime | awk -F'load average:' '{ print $2 }' | cut -d, -f1 | sed 's/^[ \t]*//')
if (( $(echo "$LOAD > $THRESHOLD_LOAD" | bc -l) )); then
echo "$(date): HIGH LOAD ALERT - Current load: $LOAD" >> $LOG_FILE
echo "System experiencing high load: $LOAD" | mail -s "Load Alert" $ALERT_EMAIL
fi
# Disk kullanımı kontrolü
DISK_USAGE=$(df -h / | awk 'NR==2 {print $5}' | cut -d'%' -f1)
if [ $DISK_USAGE -gt 90 ]; then
echo "$(date): DISK SPACE ALERT - Usage: ${DISK_USAGE}%" >> $LOG_FILE
echo "Disk usage is at ${DISK_USAGE}%" | mail -s "Disk Alert" $ALERT_EMAIL
fi
# Memory kullanımı kontrolü
MEM_USAGE=$(free | grep Mem | awk '{printf("%.1f"), $3/$2 * 100.0}')
if (( $(echo "$MEM_USAGE > 90.0" | bc -l) )); then
echo "$(date): MEMORY ALERT - Usage: ${MEM_USAGE}%" >> $LOG_FILE
fi
}
# Ana döngü
while true; do
check_system_health
sleep 300 # 5 dakikada bir kontrol
done
|
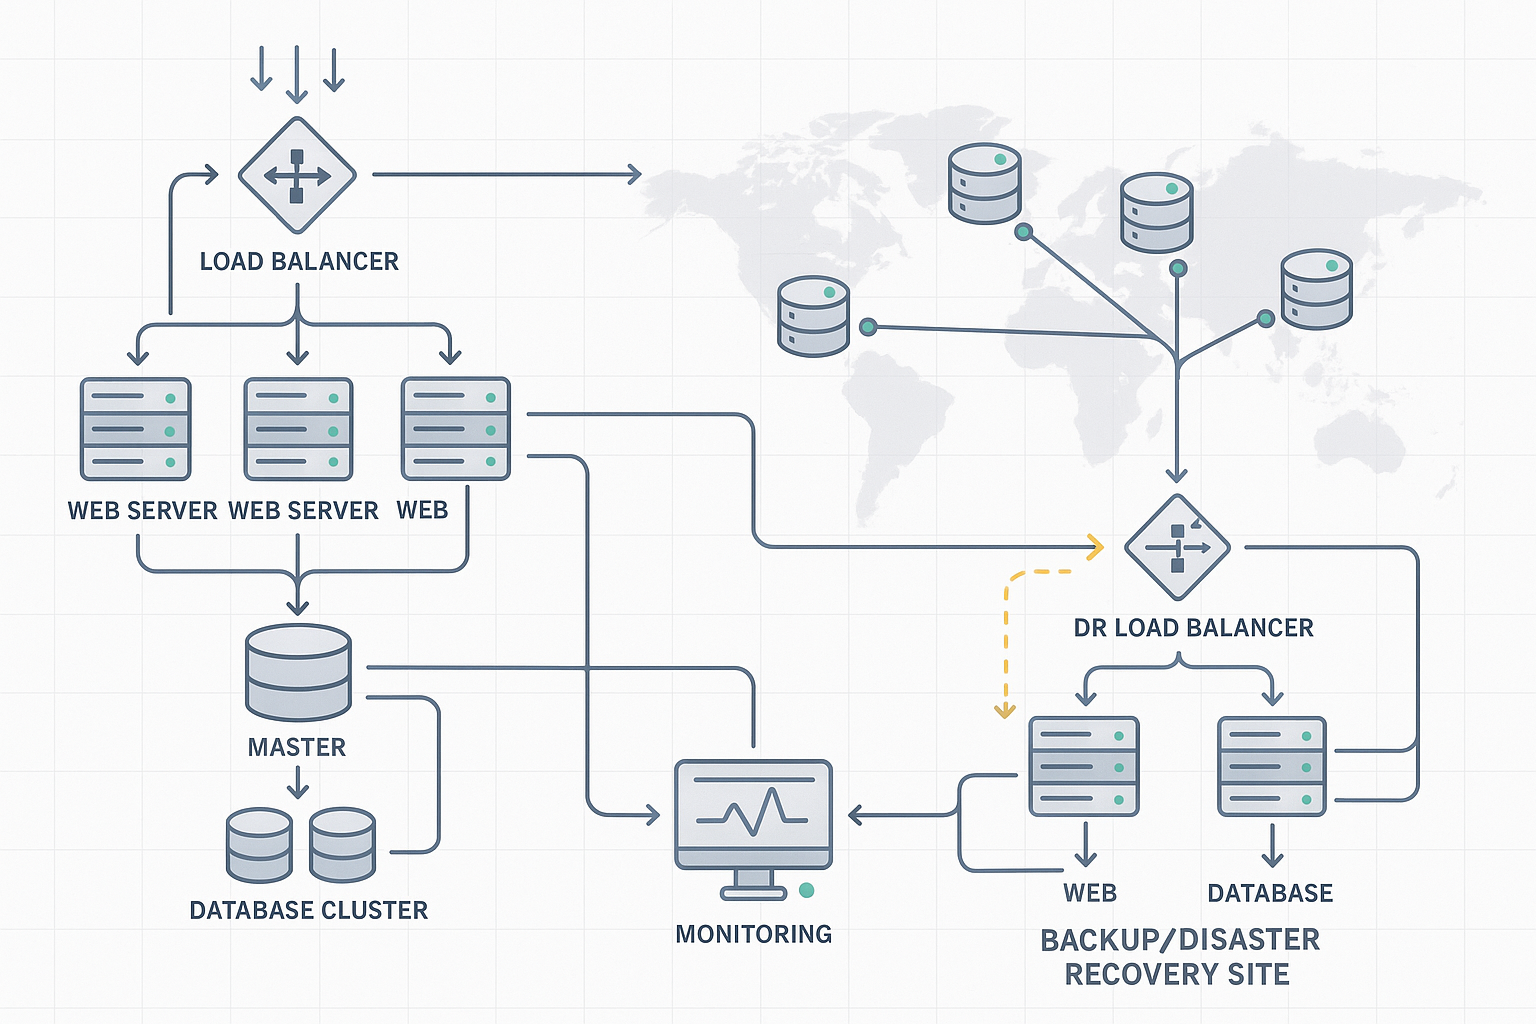
Uptime Optimizasyonu İçin Best Practice’ler
1. Redundancy ve Yedeklilik
Load Balancing
1
2
3
4
5
6
7
8
9
10
11
12
13
14
15
16
17
18
19
20
21
22
| # Nginx load balancer yapılandırması
upstream backend {
server web1.example.com:80 weight=3;
server web2.example.com:80 weight=2;
server web3.example.com:80 backup;
}
server {
listen 80;
server_name example.com;
location / {
proxy_pass http://backend;
proxy_set_header Host $host;
proxy_set_header X-Real-IP $remote_addr;
# Health check
proxy_next_upstream error timeout invalid_header http_500 http_502 http_503;
proxy_connect_timeout 1s;
proxy_read_timeout 10s;
}
}
|
Database Replication
1
2
3
4
5
6
7
8
9
10
| -- MySQL Master-Slave replication
-- Master sunucuda:
CHANGE MASTER TO
MASTER_HOST='master.example.com',
MASTER_USER='replication_user',
MASTER_PASSWORD='secure_password',
MASTER_LOG_FILE='mysql-bin.000001',
MASTER_LOG_POS=154;
START SLAVE;
|
2. Automated Failover
Keepalived ile High Availability
1
2
3
4
5
6
7
8
9
10
11
12
13
14
15
16
17
18
19
20
21
22
23
24
25
26
| # /etc/keepalived/keepalived.conf
vrrp_script chk_nginx {
script "/bin/curl -f http://localhost/ || exit 1"
interval 2
weight -2
fall 3
rise 2
}
vrrp_instance VI_1 {
state MASTER
interface eth0
virtual_router_id 51
priority 101
advert_int 1
authentication {
auth_type PASS
auth_pass mypassword
}
virtual_ipaddress {
192.168.1.100/24
}
track_script {
chk_nginx
}
}
|
3. Proactive Monitoring
Sistem Metriklerini İzleme
1
2
3
4
5
6
7
8
9
10
11
12
13
14
15
16
17
18
19
20
21
22
23
24
25
26
27
28
29
30
31
32
33
| import psutil
import time
import json
from datetime import datetime
def collect_system_metrics():
metrics = {
'timestamp': datetime.now().isoformat(),
'cpu_percent': psutil.cpu_percent(interval=1),
'memory_percent': psutil.virtual_memory().percent,
'disk_usage': psutil.disk_usage('/').percent,
'network_io': psutil.net_io_counters()._asdict(),
'load_average': psutil.getloadavg(),
'uptime': time.time() - psutil.boot_time()
}
# Anomali tespiti
if metrics['cpu_percent'] > 80:
send_alert("High CPU usage", metrics['cpu_percent'])
if metrics['memory_percent'] > 85:
send_alert("High memory usage", metrics['memory_percent'])
return metrics
def send_alert(alert_type, value):
# Slack, Discord, Email vb. alert gönderimi
webhook_url = "https://hooks.slack.com/services/YOUR/SLACK/WEBHOOK"
message = {
"text": f"🚨 {alert_type}: {value}%",
"channel": "#alerts"
}
# requests.post(webhook_url, json=message)
|
4. Capacity Planning
Trend Analysis
1
2
3
4
5
6
7
8
9
10
11
12
13
14
15
16
17
18
19
20
21
22
23
24
25
26
27
28
29
30
31
32
33
34
35
36
37
38
39
| import matplotlib.pyplot as plt
import pandas as pd
from sklearn.linear_model import LinearRegression
import numpy as np
def analyze_capacity_trends(metrics_data):
# Veri hazırlama
df = pd.DataFrame(metrics_data)
df['timestamp'] = pd.to_datetime(df['timestamp'])
df.set_index('timestamp', inplace=True)
# CPU trend analizi
X = np.array(range(len(df))).reshape(-1, 1)
y = df['cpu_percent'].values
model = LinearRegression()
model.fit(X, y)
# Gelecek tahminleri
future_points = 100 # 100 veri noktası sonrası
future_X = np.array(range(len(df), len(df) + future_points)).reshape(-1, 1)
future_cpu = model.predict(future_X)
# Grafik oluşturma
plt.figure(figsize=(12, 6))
plt.plot(df.index, df['cpu_percent'], label='Gerçek CPU Kullanımı')
plt.plot(pd.date_range(df.index[-1], periods=future_points, freq='H'),
future_cpu, label='Tahmin Edilen CPU Kullanımı', linestyle='--')
plt.axhline(y=80, color='r', linestyle='--', label='Kritik Eşik')
plt.title('CPU Kullanım Trendi ve Gelecek Tahmini')
plt.legend()
plt.xticks(rotation=45)
plt.tight_layout()
plt.show()
# Kritik eşiğe ne zaman ulaşılacağını hesaplama
if future_cpu.max() > 80:
critical_index = np.where(future_cpu > 80)[0][0]
print(f"CPU kullanımı {critical_index} saat sonra kritik seviyeye ulaşacak!")
|
Uptime İyileştirme Stratejileri
1. Infrastructure as Code (IaC)
1
2
3
4
5
6
7
8
9
10
11
12
13
14
15
16
17
18
19
20
21
22
23
24
25
26
27
28
29
30
31
32
33
34
35
36
37
38
39
40
41
| # main.tf
resource "aws_instance" "web_server" {
count = 3
ami = "ami-0c55b159cbfafe1d0"
instance_type = "t3.medium"
vpc_security_group_ids = [aws_security_group.web_sg.id]
subnet_id = aws_subnet.web_subnet[count.index].id
user_data = file("bootstrap.sh")
tags = {
Name = "WebServer-${count.index + 1}"
Environment = "production"
}
}
resource "aws_lb" "web_lb" {
name = "web-load-balancer"
internal = false
load_balancer_type = "application"
security_groups = [aws_security_group.lb_sg.id]
subnets = aws_subnet.web_subnet[*].id
}
resource "aws_lb_target_group" "web_tg" {
name = "web-targets"
port = 80
protocol = "HTTP"
vpc_id = aws_vpc.main.id
health_check {
enabled = true
healthy_threshold = 2
unhealthy_threshold = 3
timeout = 5
interval = 30
path = "/health"
matcher = "200"
}
}
|
2. Container Orchestration
Kubernetes ile High Availability
1
2
3
4
5
6
7
8
9
10
11
12
13
14
15
16
17
18
19
20
21
22
23
24
25
26
27
28
29
30
31
32
33
34
35
36
37
38
39
40
41
42
43
44
45
46
47
48
49
50
51
52
53
54
55
56
57
58
59
60
61
62
63
64
65
66
| # deployment.yaml
apiVersion: apps/v1
kind: Deployment
metadata:
name: web-app
labels:
app: web-app
spec:
replicas: 3
selector:
matchLabels:
app: web-app
template:
metadata:
labels:
app: web-app
spec:
containers:
- name: web-app
image: nginx:1.20
ports:
- containerPort: 80
resources:
requests:
memory: "128Mi"
cpu: "100m"
limits:
memory: "256Mi"
cpu: "200m"
livenessProbe:
httpGet:
path: /health
port: 80
initialDelaySeconds: 30
periodSeconds: 10
readinessProbe:
httpGet:
path: /ready
port: 80
initialDelaySeconds: 5
periodSeconds: 5
affinity:
podAntiAffinity:
preferredDuringSchedulingIgnoredDuringExecution:
- weight: 100
podAffinityTerm:
labelSelector:
matchExpressions:
- key: app
operator: In
values:
- web-app
topologyKey: kubernetes.io/hostname
---
apiVersion: v1
kind: Service
metadata:
name: web-app-service
spec:
selector:
app: web-app
ports:
- protocol: TCP
port: 80
targetPort: 80
type: LoadBalancer
|
3. Database Optimization
PostgreSQL High Availability
1
2
3
4
5
6
7
8
9
10
11
12
13
14
15
16
17
| # Streaming replication setup
# postgresql.conf (Master)
wal_level = replica
max_wal_senders = 3
checkpoint_segments = 8
wal_keep_segments = 8
# pg_hba.conf (Master)
host replication replica_user 192.168.1.0/24 md5
# Slave setup
pg_basebackup -h master_ip -D /var/lib/postgresql/data -U replica_user -v -P -W
# recovery.conf (Slave)
standby_mode = 'on'
primary_conninfo = 'host=master_ip port=5432 user=replica_user'
trigger_file = '/tmp/postgresql.trigger'
|
SLA (Service Level Agreement) Yönetimi
SLA Metriklerinin Hesaplanması
1. Availability SLA
1
2
3
4
5
6
7
8
9
10
11
12
13
14
15
16
17
18
19
20
21
22
23
24
25
26
27
28
29
30
31
32
33
34
35
36
37
38
39
40
41
42
43
44
45
46
47
48
49
50
51
52
53
54
55
56
57
58
59
60
61
62
63
64
65
66
67
68
69
70
71
72
73
74
75
76
77
78
79
80
81
82
83
84
85
86
87
88
89
| from datetime import datetime, timedelta
import calendar
class SLACalculator:
def __init__(self, target_uptime=99.9):
self.target_uptime = target_uptime
def calculate_monthly_sla(self, year, month, downtime_minutes=0):
# Aydaki toplam dakika sayısı
days_in_month = calendar.monthrange(year, month)[1]
total_minutes = days_in_month * 24 * 60
# Uptime hesaplama
uptime_minutes = total_minutes - downtime_minutes
uptime_percentage = (uptime_minutes / total_minutes) * 100
# SLA ihlali kontrolü
sla_violation = uptime_percentage < self.target_uptime
# Müşteri kredisi hesaplama (örnek)
if sla_violation:
violation_percentage = self.target_uptime - uptime_percentage
credit_percentage = min(violation_percentage * 10, 100) # Max %100 kredi
else:
credit_percentage = 0
return {
'total_minutes': total_minutes,
'downtime_minutes': downtime_minutes,
'uptime_percentage': round(uptime_percentage, 3),
'sla_target': self.target_uptime,
'sla_violation': sla_violation,
'credit_percentage': credit_percentage
}
def generate_sla_report(self, year, month, incidents):
total_downtime = sum(incident['duration_minutes'] for incident in incidents)
sla_data = self.calculate_monthly_sla(year, month, total_downtime)
report = f"""
SLA REPORT - {calendar.month_name[month]} {year}
{'='*50}
Target SLA: {self.target_uptime}%
Achieved Uptime: {sla_data['uptime_percentage']}%
Total Downtime: {total_downtime} minutes ({total_downtime/60:.2f} hours)
SLA Status: {"❌ VIOLATED" if sla_data['sla_violation'] else "✅ MET"}
INCIDENTS:
{'-'*20}
"""
for i, incident in enumerate(incidents, 1):
report += f"""
Incident #{i}:
Start: {incident['start_time']}
End: {incident['end_time']}
Duration: {incident['duration_minutes']} minutes
Root Cause: {incident['root_cause']}
Resolution: {incident['resolution']}
"""
if sla_data['credit_percentage'] > 0:
report += f"\nService Credit: {sla_data['credit_percentage']}%"
return report
# Kullanım örneği
sla_calc = SLACalculator(target_uptime=99.9)
incidents = [
{
'start_time': '2025-08-01 14:30:00',
'end_time': '2025-08-01 15:45:00',
'duration_minutes': 75,
'root_cause': 'Database connection timeout',
'resolution': 'Restarted database service and optimized connection pool'
},
{
'start_time': '2025-08-15 09:15:00',
'end_time': '2025-08-15 09:30:00',
'duration_minutes': 15,
'root_cause': 'Network equipment failure',
'resolution': 'Switched to backup network path'
}
]
report = sla_calc.generate_sla_report(2025, 8, incidents)
print(report)
|
2. Response Time SLA
1
2
3
4
5
6
7
8
9
10
11
12
13
14
15
16
17
18
19
20
21
22
23
24
25
26
27
28
29
30
31
32
33
34
35
36
37
38
39
40
41
42
43
44
45
46
47
48
49
50
51
52
53
54
55
56
57
58
59
60
61
62
63
64
65
66
67
68
69
70
71
72
73
74
75
76
77
| import statistics
from collections import defaultdict
class ResponseTimeSLA:
def __init__(self, target_percentile=95, target_response_time=200):
self.target_percentile = target_percentile
self.target_response_time = target_response_time # milliseconds
def analyze_response_times(self, response_times):
if not response_times:
return None
sorted_times = sorted(response_times)
metrics = {
'count': len(response_times),
'min': min(response_times),
'max': max(response_times),
'mean': statistics.mean(response_times),
'median': statistics.median(response_times),
'p50': self.percentile(sorted_times, 50),
'p90': self.percentile(sorted_times, 90),
'p95': self.percentile(sorted_times, 95),
'p99': self.percentile(sorted_times, 99)
}
# SLA kontrolü
target_value = metrics[f'p{self.target_percentile}']
sla_met = target_value <= self.target_response_time
metrics['sla_target'] = f'{self.target_percentile}th percentile <= {self.target_response_time}ms'
metrics['sla_achieved'] = f'{self.target_percentile}th percentile = {target_value:.2f}ms'
metrics['sla_status'] = 'MET' if sla_met else 'VIOLATED'
return metrics
def percentile(self, sorted_data, percentile):
index = (len(sorted_data) - 1) * percentile / 100
lower = int(index)
upper = lower + 1
if upper >= len(sorted_data):
return sorted_data[lower]
weight = index - lower
return sorted_data[lower] * (1 - weight) + sorted_data[upper] * weight
# Web server log analizi örneği
import re
from datetime import datetime
def parse_nginx_logs(log_file):
response_times = []
with open(log_file, 'r') as f:
for line in f:
# Nginx log formatı: IP - - [timestamp] "GET /path HTTP/1.1" status size "referer" "user-agent" request_time
match = re.search(r'(\d+\.\d+)$', line.strip())
if match:
response_time_seconds = float(match.group(1))
response_times.append(response_time_seconds * 1000) # Convert to milliseconds
return response_times
# Kullanım
# response_times = parse_nginx_logs('/var/log/nginx/access.log')
response_times = [45, 67, 123, 89, 234, 156, 78, 345, 567, 123, 89, 167, 234, 123, 89]
rt_sla = ResponseTimeSLA(target_percentile=95, target_response_time=200)
metrics = rt_sla.analyze_response_times(response_times)
print(f"Response Time Analysis:")
print(f"SLA Target: {metrics['sla_target']}")
print(f"SLA Achieved: {metrics['sla_achieved']}")
print(f"Status: {metrics['sla_status']}")
print(f"P95: {metrics['p95']:.2f}ms")
print(f"P99: {metrics['p99']:.2f}ms")
|
Gelecekteki Trendler ve Teknolojiler
1. AI/ML Destekli Predictive Monitoring
1
2
3
4
5
6
7
8
9
10
11
12
13
14
15
16
17
18
19
20
21
22
23
24
25
26
27
28
29
30
31
32
33
34
35
36
37
38
39
40
41
42
43
44
45
| import numpy as np
from sklearn.ensemble import IsolationForest
from sklearn.preprocessing import StandardScaler
import pandas as pd
class PredictiveMonitoring:
def __init__(self):
self.anomaly_detector = IsolationForest(contamination=0.1, random_state=42)
self.scaler = StandardScaler()
self.is_trained = False
def train_anomaly_detector(self, historical_metrics):
"""
Geçmiş sistem metriklerini kullanarak anomali tespiti modeli eğitimi
"""
features = ['cpu_percent', 'memory_percent', 'disk_io', 'network_io']
X = historical_metrics[features].values
# Veri normalizasyonu
X_scaled = self.scaler.fit_transform(X)
# Model eğitimi
self.anomaly_detector.fit(X_scaled)
self.is_trained = True
def predict_anomaly(self, current_metrics):
"""
Mevcut metriklerin anomali olup olmadığını tahmin etme
"""
if not self.is_trained:
raise ValueError("Model önce eğitilmelidir!")
features = ['cpu_percent', 'memory_percent', 'disk_io', 'network_io']
X = np.array([[current_metrics[f] for f in features]])
X_scaled = self.scaler.transform(X)
# Anomali skorlama
anomaly_score = self.anomaly_detector.decision_function(X_scaled)[0]
is_anomaly = self.anomaly_detector.predict(X_scaled)[0] == -1
return {
'is_anomaly': is_anomaly,
'anomaly_score': anomaly_score,
'confidence': abs(anomaly_score)
}
|
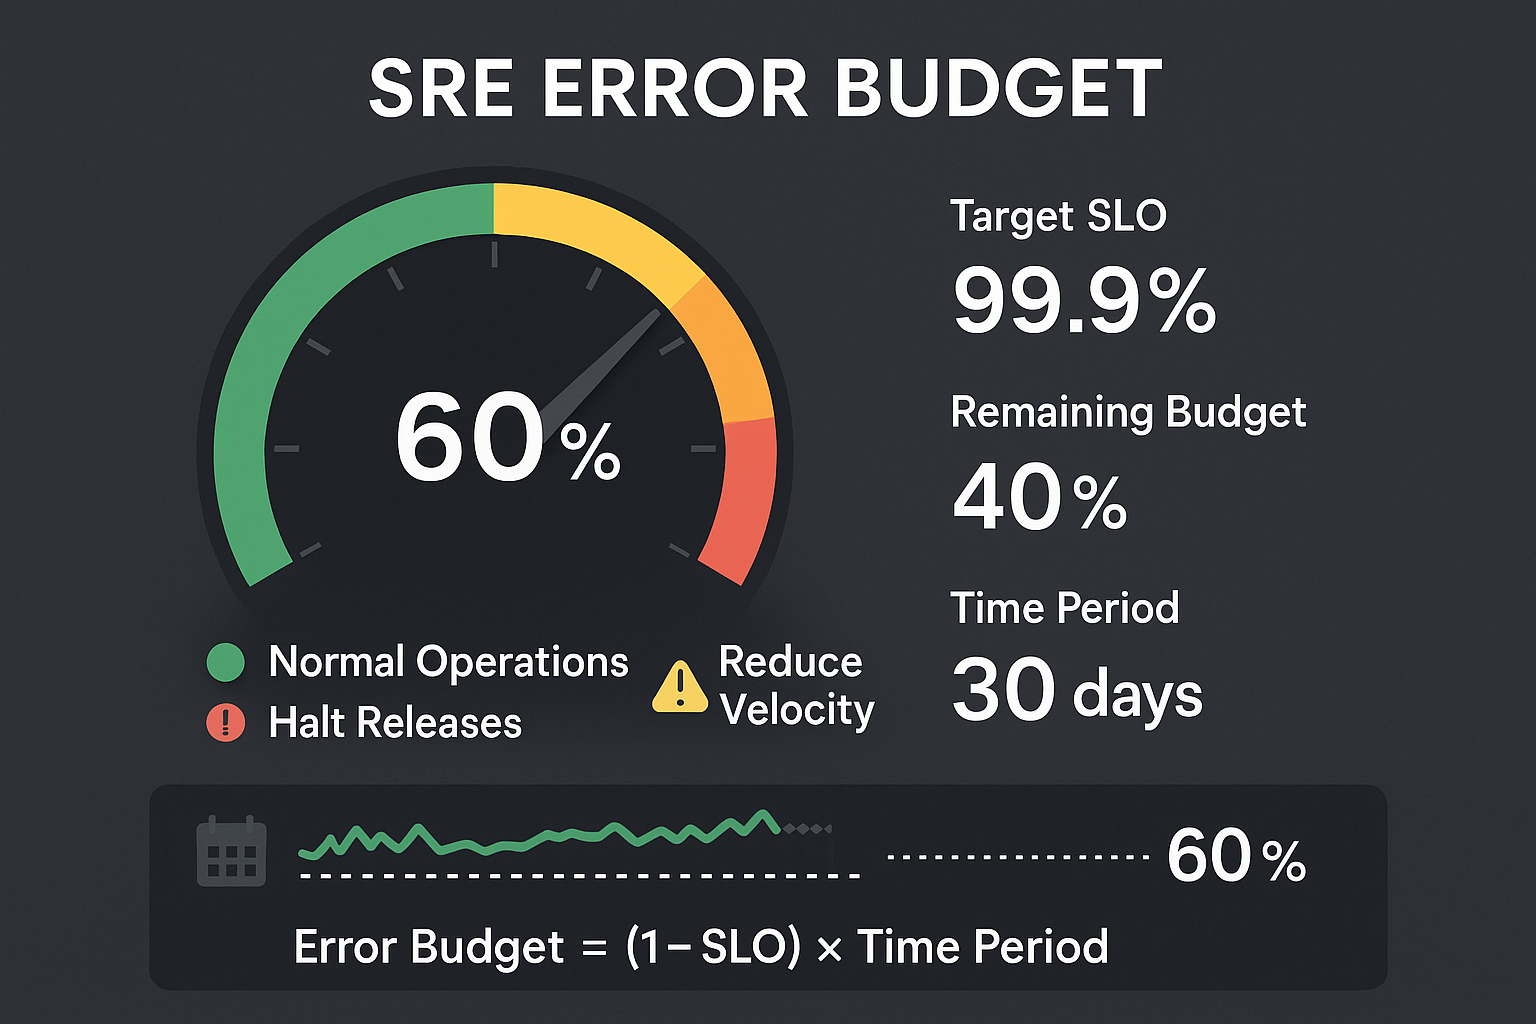
2. Site Reliability Engineering (SRE) Practices
1
2
3
4
5
6
7
8
9
10
11
12
13
14
15
16
17
18
19
20
21
22
23
24
25
26
27
28
29
30
| class ErrorBudget:
def __init__(self, slo_target=99.9, time_period_days=30):
self.slo_target = slo_target # Service Level Objective
self.time_period_days = time_period_days
self.total_minutes = time_period_days * 24 * 60
self.allowed_downtime = self.total_minutes * (1 - slo_target/100)
def calculate_error_budget(self, actual_downtime_minutes):
used_budget = actual_downtime_minutes
remaining_budget = self.allowed_downtime - used_budget
budget_percentage = (remaining_budget / self.allowed_downtime) * 100
return {
'total_budget_minutes': self.allowed_downtime,
'used_budget_minutes': used_budget,
'remaining_budget_minutes': max(0, remaining_budget),
'budget_percentage': max(0, budget_percentage),
'budget_exhausted': remaining_budget <= 0
}
def should_halt_releases(self, current_downtime):
budget_info = self.calculate_error_budget(current_downtime)
# Error budget %10'un altına düştüğünde release'leri durdur
if budget_info['budget_percentage'] < 10:
return True, "Error budget critically low - halt all releases"
elif budget_info['budget_percentage'] < 25:
return False, "Error budget low - consider reducing release velocity"
else:
return False, "Error budget healthy - normal operations"
|
3. Chaos Engineering
1
2
3
4
5
6
7
8
9
10
11
12
13
14
15
16
17
18
19
20
21
22
23
24
25
26
27
28
29
30
31
32
33
34
35
36
37
38
39
40
41
42
43
44
45
46
47
48
49
50
51
52
53
54
| import random
import subprocess
import time
from contextlib import contextmanager
class ChaosExperiment:
def __init__(self, target_service):
self.target_service = target_service
self.experiments = []
@contextmanager
def chaos_experiment(self, name, description):
print(f"🔬 Starting chaos experiment: {name}")
print(f"📝 Description: {description}")
start_time = time.time()
try:
yield
except Exception as e:
print(f"❌ Experiment failed: {e}")
raise
finally:
duration = time.time() - start_time
print(f"⏱️ Experiment completed in {duration:.2f} seconds")
def cpu_stress_test(self, duration_seconds=60):
"""CPU yoğunluğu testi"""
with self.chaos_experiment("CPU Stress", f"Stress CPU for {duration_seconds} seconds"):
# stress komutu ile CPU yükü oluşturma
process = subprocess.Popen(['stress', '--cpu', '2', '--timeout', str(duration_seconds)])
process.wait()
def network_latency_injection(self, latency_ms=100, duration_seconds=60):
"""Ağ gecikmesi enjeksiyonu"""
with self.chaos_experiment("Network Latency", f"Inject {latency_ms}ms latency for {duration_seconds}s"):
# tc (traffic control) ile network latency ekleme
subprocess.run(['sudo', 'tc', 'qdisc', 'add', 'dev', 'eth0', 'root', 'netem', 'delay', f'{latency_ms}ms'])
time.sleep(duration_seconds)
subprocess.run(['sudo', 'tc', 'qdisc', 'del', 'dev', 'eth0', 'root'])
def random_pod_killer(self, namespace='default'):
"""Kubernetes pod'larını rastgele sonlandırma"""
with self.chaos_experiment("Pod Killer", "Randomly terminate pods"):
# kubectl ile pod listesi alma
result = subprocess.run(['kubectl', 'get', 'pods', '-n', namespace, '-o', 'name'],
capture_output=True, text=True)
if result.returncode == 0:
pods = result.stdout.strip().split('\n')
if pods:
target_pod = random.choice(pods)
print(f"🎯 Terminating {target_pod}")
subprocess.run(['kubectl', 'delete', target_pod, '-n', namespace])
|
Sonuç
Uptime yönetimi, modern IT altyapısının en kritik konularından biridir. Bu rehberde ele aldığımız konular:
Önemli Çıkarımlar:
- 99.9% uptime = Yılda 8.77 saat downtime - Bu süre, kritik sistemler için oldukça yüksektir
- Proaktif izleme, reaktif müdahaleden çok daha etkilidir
- Redundancy ve failover mekanizmaları, uptime’ı artırmanın en güvenilir yollarıdır
- Error budget yaklaşımı, risk alma ve güvenilirlik arasında denge kurar
Gelecek İçin Öneriler:
- AI/ML tabanlı tahmine dayalı izleme sistemlerini benimseyin
- Chaos engineering ile sistemin dayanıklılığını test edin
- Site Reliability Engineering prensiplerini uygulayın
- Infrastructure as Code ile tutarlı ve tekrarlanabilir altyapı oluşturun
Uptime sadece teknik bir metrik değil, aynı zamanda müşteri memnuniyeti, iş sürekliliği ve rekabet avantajı için kritik bir faktördür. Doğru araçlar, süreçler ve yaklaşımlarla, yüksek uptime hedeflerine ulaşmak mümkündür.
Sistemlerinizin sürekli erişilebilir olması için bu rehberde bahsedilen stratejileri kademeli olarak implementasyona geçirin ve sürekli iyileştirme yaklaşımını benimseyin.
Bu makale sürekli güncellenmekte ve geliştirilmektedir. Sorularınız veya katkılarınız için benimle iletişime geçebilirsiniz.